India
Delhi’s Diwali Air Quality: Official AQI Below 400 While Some Apps Show Over 1,500
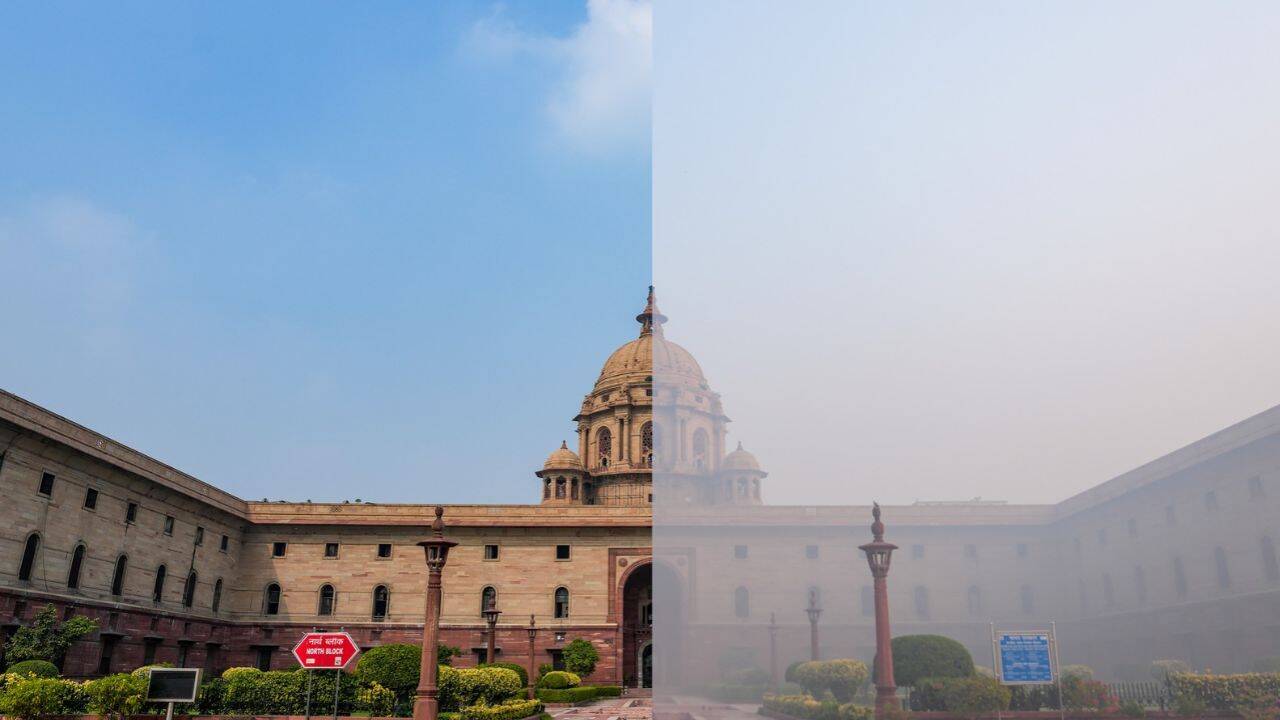
On Diwali night, screenshots of air‑quality apps circulated on social media showing Delhi’s Air Quality Index (AQI) reaching 1,500 to 1,800, while the Central Pollution Control Board (CPCB) reported figures below 400. The discrepancy stems from different AQI calculation methods. India’s National Air Quality Index (NAQI), used by CPCB, caps the scale at 500, whereas several international platforms follow the US Environmental Protection Agency (EPA) methodology, which has no upper limit. Both systems use breakpoints to convert pollutant concentrations into AQI scores, but the breakpoints and averaging periods differ. India typically uses 24‑hour averages for many pollutants, while the US EPA uses one‑hour or eight‑hour averages for some.
The spike in particulate matter was evident in monitoring data. At Jahangirpuri in northwest Delhi, the hourly PM2.5 concentration reached 4,985 µg/m³ at 6 pm and 8 pm on Diwali, before rising again at 8 am the next day. This was about 83 times the daily national ambient air quality standard of 60 µg/m³ and more than 332 times the World Health Organization’s (WHO) daily guideline of 15 µg/m³. The Delhi Pollution Control Committee (DPCC) later revised the peak to 776 µg/m³ at midnight.
Other stations recorded similarly high levels. Mundka’s PM2.5 jumped from 245 µg/m³ at 7 pm to 3,744 µg/m³ at 2 am. JNU peaked at 3,023 µg/m³ at 4 am, NSUT at 3,008 µg/m³, and Mandir Marg at 2,908 µg/m³. Nehru Nagar, Wazirpur, Talkatora Garden, CWG Sports Complex, Patparganj, and Ashok Vihar also recorded hazardous hourly PM2.5 readings ranging from 2,471 to 2,808 µg/m³.
PM10 concentrations were equally high. Punjabi Bagh reached 4,697 µg/m³, nearly 47 times the national standard of 100 µg/m³ and more than 104 times WHO’s guideline of 45 µg/m³. Anand Vihar, Patparganj, RK Puram, Nehru Nagar, and Wazirpur recorded PM10 levels between 2,671 and 3,929 µg/m³.
Sunil Dahiya, founder of Envirocatalyst, noted that during Diwali night people inhaled PM2.5 averaging 450 to 550 µg/m³, eight to nine times the national 24‑hour standard and 30 to 37 times WHO’s guideline. He warned that such exposure can trigger asthma, worsen lung disease, and increase heart attack and stroke risk, especially for children, the elderly, pregnant women, outdoor workers, and those with pre‑existing conditions.
CPCB explained that other AQI methodologies use different breakpoint concentrations and may source data from both government and non‑government sensors, including low‑cost devices with variable calibration. Consequently, AQI values from international apps are not directly interchangeable with CPCB’s official NAQI and should not be treated as regulatory indicators.
The board emphasized that the NAQI published by CPCB is the official AQI for public dissemination, and other figures are not recognized for regulatory or reporting purposes.
Frequently asked questions
Why did apps show AQI over 1,500 while CPCB reported below 400?
CPCB uses the National Air Quality Index (NAQI) capped at 500, whereas many apps use the US EPA methodology with no upper limit and different averaging periods.
What were the PM2.5 levels recorded at Jahangirpuri during Diwali?
The hourly PM2.5 concentration reached 4,985 µg/m³ at 6 pm and 8 pm, later revised to 776 µg/m³ at midnight.
What health risks were highlighted by Sunil Dahiya?
He warned that inhaling PM2.5 averaging 450 to 550 µg/m³ can trigger asthma, worsen lung disease, and increase heart attack and stroke risk, especially for children, the elderly, pregnant women, outdoor workers, and those with pre‑existing conditions.