Business & Finance
India’s Manufacturing Corporate Sector GVA Rises 9.28% in FY25, Survey Shows
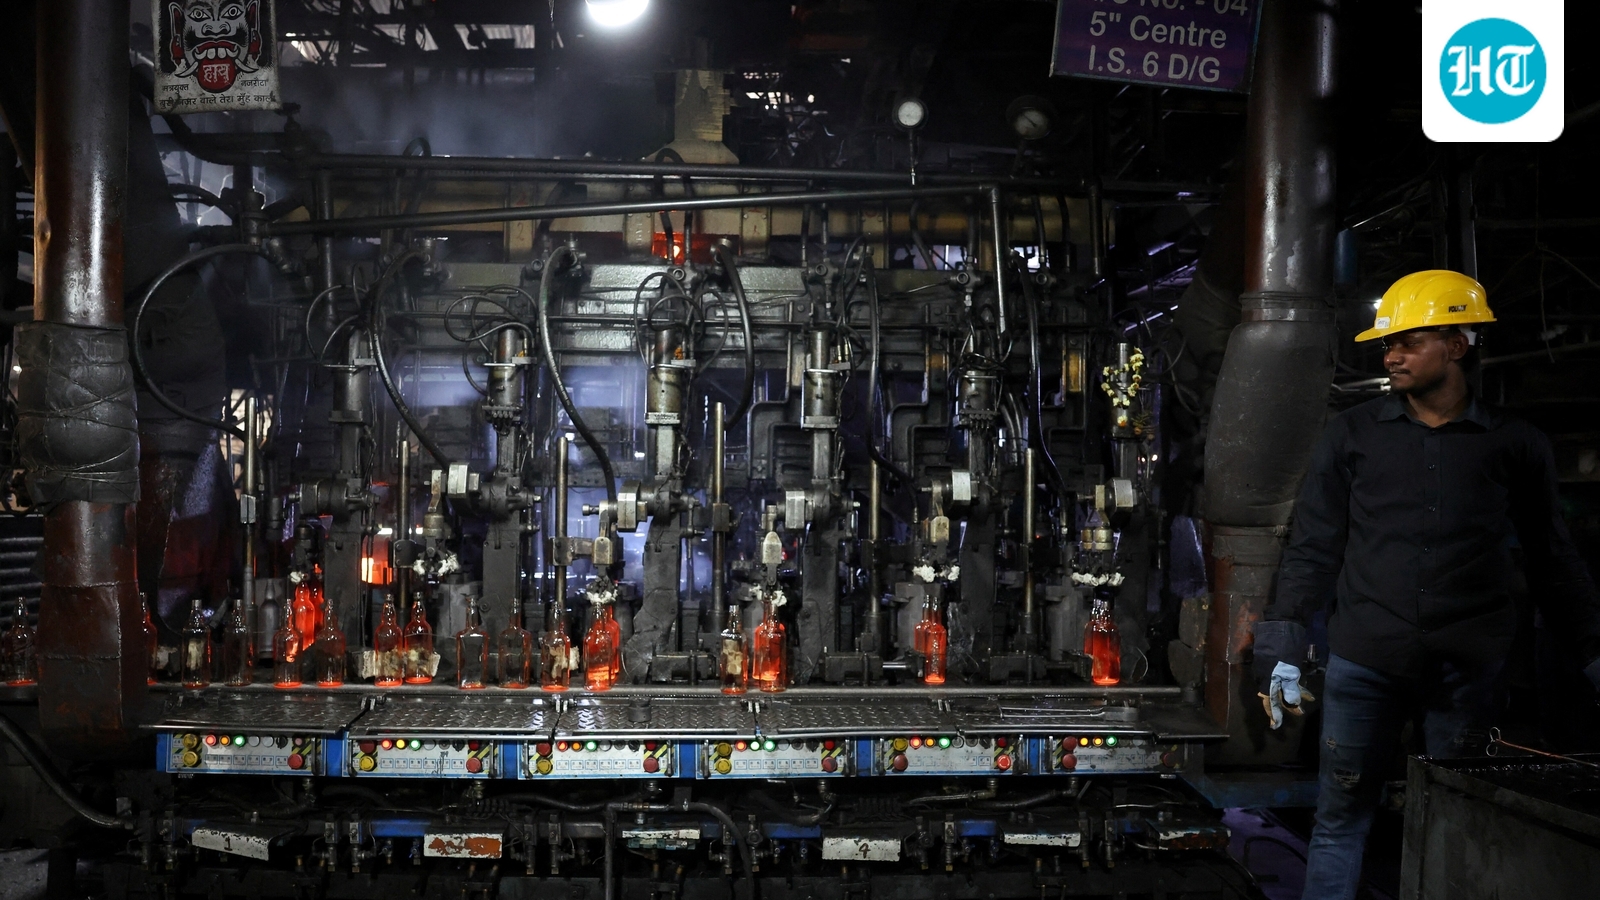
The gross value added (GVA) of India’s manufacturing corporate sector grew 9.28% in 2024‑25, while the number of factories in operation increased by 3.45% and total employment rose 7.57%, according to the latest Annual Survey of Industries (ASI) released by the Ministry of Statistics and Programme Implementation on Wednesday. The manufacturing corporate sector accounted for more than 89% of the total GVA during the financial year, underscoring its dominant role in the country’s registered industrial output.
The survey also recorded a 7.25% increase in the gross value of plant and machinery in the registered manufacturing sector over the previous year. Net value added per factory in operation rose 6.59%, and GVA per person engaged increased by 2.25%.
The ministry published Volume I and the Summary Results of the Factory Sector of ASI 2024‑25, along with unit‑level data and metadata, providing a detailed picture of performance, investment patterns, employment and output of India’s registered manufacturing sector.
The five leading industries—food products, textiles, basic metals, motor vehicles and wearing apparel—together accounted for more than 41% of total manufacturing employment during 2024‑25. Geographically, Maharashtra, Gujarat, Tamil Nadu, Karnataka and Uttar Pradesh emerged as the five largest contributors to manufacturing GVA, collectively accounting for more than 54% of the national total.
The survey highlighted a significant concentration of capital and production among larger factories. Units with an investment of ₹10 crore or more in plant and machinery constituted 15.84% of operational factories but accounted for 87.42% of total fixed capital, 59.66% of employment, 76.82% of gross output and 78.07% of net value added. In contrast, factories with investment of up to ₹5 crore represented 78.69% of operational units, contributing 10.55% of fixed capital, 34.32% of persons engaged, 19.24% of total output and 17.61% of net value added.
A similar concentration was evident when factories were classified by output. Units producing more than ₹10 crore worth of output accounted for 47.63% of operational factories but contributed 98.10% of total output and 97.87% of net value added. They also accounted for 95.55% of fixed capital and 88.78% of employment.
The ASI is the principal source of industrial statistics on the organised manufacturing sector and provides information on capital formation, employment, wages, input costs, output and value addition. Its findings are also used in compiling national and state‑level national accounts statistics. The detailed publications supplement the factsheet released on 30 September 2026 and provide results at the national, state and industry levels. Volume I contains detailed factory‑sector statistics classified according to the National Industrial Classification (NIC), 2008, while the summary publication presents key indicators of industrial performance across states and Union territories. The survey covers registered factories, certain bidi and cigar manufacturing establishments, electricity undertakings and eligible establishments with 100 or more employees. Data are collected electronically through a dedicated web portal.
Frequently asked questions
What was the growth rate of India’s manufacturing corporate sector GVA in FY25?
The GVA grew 9.28% in 2024‑25.
How did the number of factories and employment change in FY25?
The number of factories increased by 3.45% and total employment rose 7.57%.
Which states contributed most to manufacturing GVA in FY25?
Maharashtra, Gujarat, Tamil Nadu, Karnataka and Uttar Pradesh together accounted for more than 54% of the national total.